Dans une étude largement citée (2008) Jaeggi affirme que l’entraînement cognitif, plus précisément “working memory training”, pouvait augmenter sensiblement le QI. Jaeggi et ses collègues utilisent ce qu’on nomme le “Dual n-back”, qui consiste en deux tâches ou séquences indépendantes présentées simultanément. L’une est auditive, l’autre est visuelle. Voir la Figure 1 présentée par Jaeggi :

![]() Tel qu’ils le montrent, la pratique du ‘dual n-back task’ pourrait stimuler l’intelligence fluide, à savoir, la capacité à penser logiquement et à résoudre des problèmes nouveaux. Rappelons que l’entraînement au ‘working memory’ training serait totalement inefficace si de tels programmes provoquent des effets sur des tests similaires à ceux qui ont été entraînés et exercés. C’est parce que le facteur g traite des problèmes nouveaux et inhabituels.
Tel qu’ils le montrent, la pratique du ‘dual n-back task’ pourrait stimuler l’intelligence fluide, à savoir, la capacité à penser logiquement et à résoudre des problèmes nouveaux. Rappelons que l’entraînement au ‘working memory’ training serait totalement inefficace si de tels programmes provoquent des effets sur des tests similaires à ceux qui ont été entraînés et exercés. C’est parce que le facteur g traite des problèmes nouveaux et inhabituels.
The finding that the transfer to Gf remained even after taking the specific training effect into account seems to be counterintuitive, especially because the specific training effect is also related to training time. The reason for this capacity might be that participants with a very high level of n at the end of the training period may have developed very task specific strategies, which obviously boosts n-back performance, but may prevent transfer because these strategies remain too task-specific (5, 20). The averaged n-back level in the last session is therefore not critical to predicting a gain in Gf; rather, it seems that working at the capacity limit promotes transfer to Gf.
Cette étude présente toutefois des faiblesses. D’abord, comme Sternberg (2008) l’a fait savoir, les résultats obtenus par Jaeggi devraient être examinés avec prudence (voir aussi, Conway & Getz, 2010). L’utilisation d’un seul test d’entraînement et l’absence de test alternatif sont de sérieuses limitations de l’étude, en plus des multiples interrogations quant à la permanence du pouvoir prédictif des tests de capacité fluide après l’entraînement et la durabilité des gains de QI :
First, with regard to the main independent variable, there was only one training task in the study, so it is unclear to what extent the results can be generalized to other working-memory tasks. It would be important to show that the results are really about working memory rather than some peculiarity of the particular training task.
Second, with regard to the main dependent variable, there was only one kind of fluid-ability test, geometric matrix problems from various tests of the kind found in the Raven Progressive Matrices (15) and similar tests. It would be important to show that the results generalize to other fluid-ability tasks rather than being peculiar to this kind of task. Matrix problems are generally considered to be an excellent measure of fluid intelligence (16), but they do place a particularly great demand on working memory. At the same time, fluid-ability tests tend to be highly correlated with each other (17), so generalization would appear likely. Whether generalization extends beyond the matrix tests to other kinds of cognitive tests, such as of spatial, numerical, or other abilities, remains to be seen. […]
Sixth, the control group in Jaeggi et al.’s study (10) had no alternative task, which can lead readers to query whether a placebo treatment in an additional control group might have led to a stronger comparison. In future work, one would want to include a training alternative that teaches something expected not to be relevant to performance on the fluid-ability tests.
Mais le détail qui brise sérieusement la crédibilité de l’étude de Jaeggi (2008) est l’accélération de l’administration des tests de QI (10 minutes au lieu de 45 minutes) pour les groupes utilisant le BOMAT. Peu après que l’étude ait été publiée, Moody (2009) a mis en évidence les failles, si ce n’est la fraude, de cette étude. Jaeggi a délibérément réduit le temps alloué au test de QI de sorte que les sujets ne pouvaient pas avoir le temps de tester et résoudre les items les plus complexes. Ainsi, le test échoue à présenter un challenge pour l’intelligence fluide. Pire, le dual n-back task, bien que différent du RAPM et du BOMAT (deux tests de QI similaires), n’apparaît pas être très différent du transfert de tâche, qui est, le test de QI. En effet, une des deux tâches de travail de mémoire “involved recall of the location of a small square in one of several positions in a visual matrix pattern”. Ceci n’apparaît effectivement pas être très différent de la nature du transfert de tâche, qui est, le test de BOMAT. De fait, il est difficile d’accepter l’affirmation de Jaeggi selon laquelle “the trained task is entirely different from the intelligence test itself”. Pas surprenant si Jaeggi et al. (2008) ont trouvé des améliorations de score pour le BOMAT, mais pas pour le RAPM. Quoi qu’il en soit, la critique de Moody (2009) mérite définitivement d’être citée en entier :
The subjects were divided into four groups, differing in the number of days of training they received on the task of working memory. The group that received the least training (8 days) was tested on Raven’s Advanced Progressive Matrices (Raven, 1990), a widely used and well-established test of fluid intelligence. This group, however, demonstrated negligible improvement between pre- and post-test performance.
The other three groups were not tested using Raven’s Matrices, but rather on an alternative test of much more recent origin. The Bochumer Matrices Test (BOMAT) (Hossiep, Turck, & Hasella, 1999) is similar to Raven’s in that it consists of visual analogies. In both tests, a series of geometric and other figures is presented in a matrix format and the subject is required to infer a pattern in order to predict the next figure in the series. The authors provide no reason for switching from Raven’s to the BOMAT.
The BOMAT differs from Raven’s in some important respects, but is similar in one crucial attribute: both tests are progressive in nature, which means that test items are sequentially arranged in order of increasing difficulty. A high score on the test, therefore, is predicated on subjects’ ability to solve the more difficult items.
However, this progressive feature of the test was effectively eliminated by the manner in which Jaeggi et al. administered it. The BOMAT is a 29-item test which subjects are supposed to be allowed 45 min to complete. Remarkably, however, Jaeggi et al. reduced the allotted time from 45 min to 10. The effect of this restriction was to make it impossible for subjects to proceed to the more difficult items on the test. The large majority of the subjects — regardless of the number of days of training they received — answered less than 14 test items correctly.
By virtue of the manner in which they administered the BOMAT, Jaeggi et al. transformed it from a test of fluid intelligence into a speed test of ability to solve the easier visual analogies.
The time restriction not only made it impossible for subjects to proceed to the more difficult items, it also limited the opportunity to learn about the test — and so improve performance — in the process of taking it. This factor cannot be neglected because test performance does improve with practice, as demonstrated by the control groups in the Jaeggi study, whose improvement from pre- to post-test was about half that of the experimental groups. The same learning process that occurs from one administration of the test to the next may also operate within a given administration of the test — provided subjects are allowed sufficient time to complete it.
Since the whole weight of their conclusion rests upon the validity of their measure of fluid intelligence, one might assume the authors would present a careful defense of the manner in which they administered the BOMAT. Instead they do not even mention that subjects are normally allowed 45 min to complete the test. Nor do they mention that the test has 29 items, of which most of their subjects completed less than half.
The authors’ entire rationale for reducing the allotted time to 10 min is confined to a footnote. That footnote reads as follows:
Although this procedure differs from the standardized procedure, there is evidence that this timed procedure has little influence on relative standing in these tests, in that the correlation of speeded and non-speeded versions is very high (r = 0.95; ref. 37).
The reference given in the footnote is to a 1988 study (Frearson & Eysenck, 1986) that is not in fact designed to support the conclusion stated by Jaeggi et al. The 1988 study merely contains a footnote of its own, which refers in turn to unpublished research conducted forty years earlier. That research involved Raven’s matrices, not the BOMAT, and entailed a reduction in time of at most 50%, not more than 75%, as in the Jaeggi study.
So instead of offering a reasoned defense of their procedure, Jaeggi et al. provide merely a footnote which refers in turn to a footnote in another study. The second footnote describes unpublished results, evidently recalled by memory over a span of 40 years, involving a different test and a much less severe reduction in time.
In this context it bears repeating that the group that was tested on Raven’s matrices (with presumably the same time restriction) showed virtually no improvement in test performance, in spite of eight days’ training on working memory. Performance gains only appeared for the groups administered the BOMAT. But the BOMAT differs in one important respect from Raven’s. Raven’s matrices are presented in a 3 × 3 format, whereas the BOMAT consists of a 5 × 3 matrix configuration.
With 15 visual figures to keep track of in each test item instead of 9, the BOMAT puts added emphasis on subjects’ ability to hold details of the figures in working memory, especially under the condition of a severe time constraint. Therefore it is not surprising that extensive training on a task of working memory would facilitate performance on the early and easiest BOMAT test items — those that present less of a challenge to fluid intelligence.
This interpretation acquires added plausibility from the nature of one of the two working-memory tasks administered to the experimental groups. The authors maintain that those tasks were “entirely different” from the test of fluid intelligence. One of the tasks merits that description: it was a sequence of letters presented auditorily through headphones.
But the other working-memory task involved recall of the location of a small square in one of several positions in a visual matrix pattern. It represents in simplified form precisely the kind of detail required to solve visual analogies. Rather than being “entirely different” from the test items on the BOMAT, this task seems well-designed to facilitate performance on that test.
Par la suite, Jaeggi et al. (2010, p. 9) ont répondu à Moody en faisant valoir que l’accélération et la non-accélération de l’administration des tests de QI, loin d’altérer les résultats, produisent des résultats similaires :
Moody (2009) has argued that restricting the tests to just the early items leaves out the items that have higher Gf loadings. This issue has been addressed before by other researchers who investigated whether there are differential age effects or working memory involvement in the different parts of the APM (Salthouse, 1993; Unsworth & Engle, 2005). These studies found no evidence for differential processes in the various items of the APM, at least for the first three quartiles of the task; thus, it seems unlikely that a subset of items in the APM measures something different than Gf. In our own data, the transfer effects were actually more pronounced for the second half of the test in the APM, which is reflected in a significant 3-way interaction … . In the BOMAT, we observed no differential transfer effects for the earlier vs later items … . Thus, if there are any differences in Gf loading in the various parts of the matrices tasks, the present data suggest that the transfer effects are roughly equivalent for the parts of the test that are claimed to have higher vs lower Gf loadings.
Chooi (2011, pp. 11-12), après avoir discuté Jaeggi (2008), estime être en désaccord avec la défense de Jaeggi (2010). Effectivement, Chooi (2011, p. 62) n’a pas réussi à répliquer Jaeggi (2008, 2010). Subséquement, Chooi & Thompson (2012, pp. 537-538) ont encore essayé de répliquer Jaeggi. De nouveau, ils rapportent un résultat nul accompagné d’une preuve supplémentaire que, contrairement à la déclaration de Jaeggi (2010, p. 9), une administration non accélérée du test de QI a son importance :
The numbers suggested that participants from the current study and the original Jaeggi et al. (2008) study showed very similar performance on the training task; however, upon closer inspection of the data reported by Jaeggi et al., 2008, the authors collapsed post-test scores for all training groups and concluded a significant improvement in performance on intelligence tests after training based on an increase in about 2.5 points. This is misleading and inappropriate since not all participants took the same test for the purposes of detecting transfer effects. … Although our data on training improvement cannot be directly compared with those obtained from the two studies by Jaeggi et al. (2008, 2010), we argue that participants who trained their working memory in the current study improved on the training task just as much and that participants in the current study were just as motivated and committed as participants in the original study conducted by Jaeggi et al. (2008).
Participants in the current study and those in the studies conducted by Jaeggi et al. (2008, 2010) took the test under different administration procedures. RAPM was administered with no time constraint in the current study as recommended by the test provider, so participants were allowed to solve as many items as they could under no time pressure. Jaeggi and her colleagues administered their transfer tasks, the RAPM and BOMAT, with a time constraint — participants in their studies only had 10 min to solve as many items as they could (Jaeggi et al., 2008). In their first study, those in the 19-day training group answered about 4 more items on the BOMAT correctly at post-test (Jaeggi et al., 2008) and in their second study, the 20-day training group correctly answered 3 additional items in 16 min at post-test (Jaeggi et al., 2010). In their replication study, participants answered 2 additional items on the RAPM in 11 min after training for 20 days (Jaeggi et al., 2010). There was inconsistent usage of transfer tasks in the original study, where the researchers used the RAPM in the 8-day condition and not in the other training conditions. Participants who trained for 8-days showed no significant improvement on the RAPM at post-test (Jaeggi et al., 2008).
… Participants were told that there were no time constraints and they could take as much time as they wanted to complete the items on both tests, so there were participants who took more than 20 min to complete both tests. Similarly, participants were given 15–20 min at the beginning of post-test session to work on the Mill-Hill and RAPM before the timed tests and OSPAN were administered. In essence, participants in the current study had as much time as those in the studies carried out by Jaeggi et al. (2008, 2010) with the added advantage of no time pressure exerted on the participants. Though Jaeggi et al. argued that the timed administration of RAPM/BOMAT in their studies was not an issue, the untimed administration of the same test in our study showed no significant improvements in RAPM scores.
The current study was designed to replicate and extend the original study by Jaeggi et al. (2008); thus, it was designed not only to detect an increase in scores but also to determine how the increase in performance arose should there be any, whether through improvements in verbal, perceptual or spatial rotation abilities following Johnson and Bouchard’s (2005a) VPR model of intelligence. If general intelligence was improved after working memory training, it is imperative to know what underlying ability(ies) specifically led to an increase in general intelligence. The series of short, timed mental abilities tests administered in the current study were to provide additional information should there be an increase in the transfer task, RAPM. These tests were selected based on Johnson and Bouchard’s (2005a) proposed model of intelligence, and exploratory factor analysis conducted on the test variables at pre-test (N=117) in the current study supported the model (Table 5). However, results from the current study suggested no improvement overall in each of the three abilities.
Thompson et al. (2013, pp. 9-11) montrent subséquemment que les gains de QI (après 20 sessions) dans les tests entraînés ont prouvé être durables sur une période de 6 mois. Cependant, il n’y avait aucune preuve d’un effet de transfert ou généralisation sur les tests non entraînés pour les sujets démontrant les plus grands gains de QI. En outre, ils ne trouvent pas que la personnalité et la motivation soient clairement associées aux résultats positifs de transfert de tâche. Bien que Jaeggi (2008) a rapporté un effet de taille important, les sujets de Thompson (2013) ont reçu 33% plus d’entraînement par session mais ne se retrouvent pas avec un gain plus grand comparé à Jaeggi.
Parallèlement, Jaeggi (2011) revient avec une autre étude, répliquant ses précédentes recherches :
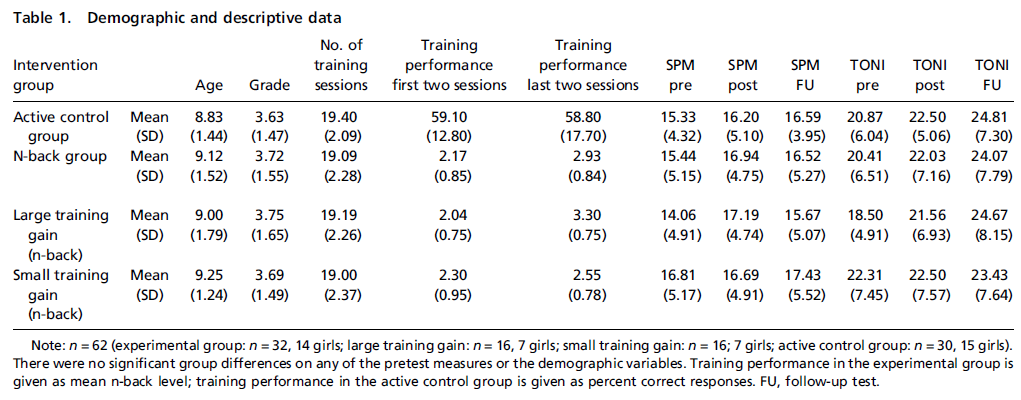
La Table 1 montre les résultats (SPM signifie Raven’s Standard Progressive Matrices et TONI signifie Test of Nonverbal Intelligence). Curieusement, le groupe de contrôle “who trained on a knowledge-based task that did not engage working memory” se retrouve avec un score SPM supérieur à celui du groupe ayant enregistré de larges gains d’entraînement dont les scores ont régressé durant le suivi comparé à la période post-test. Le groupe de contrôle a aussi surpassé les groupes ayant enregistré des gains larges ou minuscules sur le TONI durant la période de suivi.
Néanmoins, même si nous acceptons la conclusion de Jaeggi, il reste à savoir si en moyenne les études menées sur ce terrain particulier ont produit des résultats encourageant. De façon générale, les recherches semblent mixtes, si ce n’est pas pessimistes (Shipstead et al., 2010, pp. 255-270; Seidler et al., 2010; Fox & Charness, 2010; Zinke et al. 2012; Brehmer et al., 2012).
Une méta-analyse serait donc très utile à cet égard. En fait, c’est exactement ce que Monica Melby-Lervåg et Charles Hulme (2012) ont fait. Un détail qui a son importance est que dans leur méta-analyse, ils ont exclu certaines études pour ne pas avoir appliqué un critère méthodologique adéquat (voir pp. 4-5), particulièrement l’utilisation des groupes de contrôle “sans-contact” qui sur-estime l’effet de taille (voir Shipstead, 2012b, p. 191; et aussi Shipstead et al., 2010, pp. 251-252, pour une discussion approfondie) dû à l’effet placebo ou Hawthorne. Un autre problème est la régression vers la moyenne, qui consiste en ce que les individus à faible QI scorent plus haut à la phase retest et les individus à fort QI scorant plus bas à la phase retest, devant être traité par la randomisation des sujets dans différents groupes. Concernant les études incluses dans leur méta-analyse, ils ont trouvé un effet de taille global allant de 0.16 à 0.23, ce qui est somme tout modéré. Et encore, l’effet de taille est de 0.04 pour les études utilisant la procédure de randomisation et même de 0.00 pour les études utilisant des groupes actifs de contrôle (Table 2). Voici les résultats :
Immediate Effects of Working Memory Training on Far-Transfer Measures

Nonverbal ability. Figure 6 shows the 22 effect sizes comparing the pretest–posttest gains between working memory training groups and control groups on nonverbal ability (N training groups = 628, mean sample size = 28.54, N controls = 528, mean sample size = 24.0). The mean effect size was small (d = 0.19), 95% CI [0.03, 0.37], p = .02. The heterogeneity between studies was significant, Q(21) = 39.17, p < .01, I² = 46.38%. The funnel plot indicated a publication bias to the right of the mean (i.e., studies with a higher effect size than the mean appeared to be missing), and in a trim and fill analysis, the adjusted effect size after imputation of five studies was d = 0.34, 95% CI [0.17, 0.52]. A sensitivity analysis showed that after removing outliers, the overall effect size ranged from d = 0.16, 95% CI [0.00, 0.32], to d = 0.23, 95% CI [0.06, 0.39].
Moderators of immediate transfer effects of working memory training to measures of nonverbal ability are shown in Table 2. There was a significant difference in outcome between studies with treated controls and studies with only untreated controls. In fact, the studies with treated control groups had a mean effect size close to zero (notably, the 95% confidence intervals for untreated controls were d = -.24 to 0.22, and for treated controls d = 0.23 to 0.56). More specifically, several of the research groups demonstrated significant transfer effects to nonverbal ability when they used untreated control groups but did not replicate such effects when a treated control group was used (e.g., Jaeggi, Buschkuehl, Jonides, & Shah, 2011; Nutley, Söderqvist, Bryde, Thorell, Humphreys, & Klingberg, 2011). Similarly, the difference in outcome between randomized and nonrandomized studies was close to significance (p = .06), with the randomized studies giving a mean effect size that was close to zero. Notably, all the studies with untreated control groups are also nonrandomized; it is apparent from these analyses that the use of randomized designs with an alternative treatment control group are essential to give unambiguous evidence for training effects in this field.
Long-Term Effects of Working Memory Training on Transfer Measures

Table 4 shows the total number of participants in training and control groups, the total number of effect sizes, the time between the posttest and the follow-up, and the mean difference in gain between training and control groups from the pretest to the follow-up. It is apparent that all these long-term effects were small and nonsignificant. The true heterogeneity between studies was zero for all variables, indicating that the results were consistent across the studies included here. The funnel plot with trim and fill analyses did not indicate any publication bias. As for the attrition rate, on average, the studies lost 10% of the participants in the training group and 11% of the participants in the control group between the posttest and the follow-up. Only one study with two independent comparisons reported long-term effects for verbal ability (E. Dahlin et al., 2008). For the younger sample in this study, with 11 trained and seven control participants, long-term effects for verbal ability was nonsignificant (d = 0.46) 95% CI [-0.45, 1.37]. For the older participants in this study (13 trained, seven controls), the long term effects were negative and nonsignificant (d = -0.08), 95% CI [-0.96, 0.80].
In summary, there is no evidence from the studies reviewed here that working memory training produces reliable immediate or delayed improvements on measures of verbal ability, word reading, or arithmetic. For nonverbal reasoning, the mean effect across 22 studies was small but reliable immediately after training. However, these effects did not persist at the follow-up test, and in the best designed studies, using a random allocation of participants and treated controls, even the immediate effects of training were essentially zero. For attention (Stroop task), there was a small to moderate effect immediately after training, but the effect was reduced to zero at follow-up.
Methodological Issues in the Studies of Working Memory Training
Several studies were excluded because they lack a control group, since as outlined in the introduction, such studies cannot provide any convincing support for the effects of an intervention (e.g., Holmes et al., 2010; Mezzacappa & Buckner, 2010). However, among the studies that were included in our review, many used only untreated control groups. As demonstrated in our moderator analyses, such studies typically overestimated effects due to training, and research groups who demonstrated transfer effects when using an untreated control group typically failed to replicate such effects when using treated controls (Jaeggi, Buschkuehl, Jonides, & Shah, 2011; Nutley, Söderqvist, Bryde, Thorell, Humphreys, & Klingberg, 2011). Also, because the studies reviewed frequently use multiple significance tests on the same sample without correcting for this, it is likely that some group differences arose by chance (for example, if one conducts 20 significance tests on the same data set, the Type 1 error rate is 64% (Shadish, Cook, & Campbell, 2002). Especially if only a subset of the data is reported, this can be very misleading.
Finally, one methodological issue that is particularly worrying is that some studies show far-transfer effects (e.g., to Raven’s matrices) in the absence of near-transfer effects to measures of working memory (e.g., Jaeggi, Busckuehl, Jonides, & Perrig, 2008; Jaeggi et al., 2010). We would argue that such a pattern of results is essentially uninterpretable, since any far-transfer effects of working memory training theoretically must be caused by changes in working memory capacity. The absence of working memory training effects, coupled with reliable effects on far-transfer measures, raises concerns about whether such effects are artifacts of measures with poor reliability and/or Type 1 errors. Several of the studies are also potentially vulnerable to artifacts arising from regression to the mean, since they select groups on the basis of extreme scores but do not use random assignment (e.g., Holmes, Gathercole, & Dunning, 2009; Horowitz-Kraus & Breznitz, 2009; Klingberg, Forssberg, & Westerberg, 2002).
En plus de la méta-analyse de Melby-Lervåg, d’autres expériences non mentionnées dans son étude ont aussi trouvé un résultat négatif, échouant à répliquer Jaeggi et les autres. Shipstead et al. (2012a) et Redick et al. (2012), par exemple.
Dans, Is Working Memory Training Effective?, Shipstead et al. (p. 6) indiquent que les capacités cognitives dans la plupart de ces études sont mesurées via des tests uniques, avec le problème inhérent que les scores sur un seul test unique sont entraînés à la fois par les capacités d’intérêt et les autres influences aléatoires et systématiques. Pour pouvoir ne serait-ce qu’observer un réel étendu des effets de transfert, il est nécessaire d’administrer aux sujets des batteries de tests très larges et variées. Dans la Figure 3, ci-dessous, les chiffres à l’extrême gauche de l’image montrent les corrélations ou saturations des facteurs, indiquant la portion de chaque test qui est expliquée par WMC, allant de 46% à 70% (obtenus en multipliant les corrélations par leur carré). Et ils notent bien sûr “While some tasks provide stronger reflections of WM capacity than others, no single task reflects WM capacity alone.” (p. 7).

Likewise, far transfer tasks are not perfect measures of ability. In many training studies, Raven’s Progressive Matrices (Ravens; Raven, 1990, 1995, 1998) serves as the sole indicator of Gf. This “matrix reasoning” task presents test takers with a series of abstract pictures that are arranged in a grid. One piece of the grid is missing, and the test taker must choose an option (from among several) that completes the sequence. Jensen (1998) estimates that 64% of the variance in Ravens performance can be explained by Gf. Similarly, Figure 3 indicates that in the study of Kane et al. (2004), 58% of the Ravens variance was explained by Gf.
It is clear that Ravens is strongly related to Gf. However, 30%–40% of the variance in Ravens is attributable to other influences. Thus, when Ravens (or any other task) serves as the sole indicator of far transfer, performance improvements can be explained without assuming that a general ability has changed. Instead, it can be parsimoniously concluded that training has influenced something that is specific to performing Ravens, but not necessarily applicable to other reasoning contexts (Carroll, 1993; Jensen, 1998; Moody, 2009; Schmiedek et al., 2010; te Nijenhuis, van Vianen, & van der Flier, 2007).
… Preemption of criticisms such as Moody’s (2009) is, however, readily accomplished through demonstration of transfer to several measures of an ability.
Unfortunately, the practice of equating posttest improvement on one task with change to cognitive abilities is prevalent within the WM training literature (cf. Jaeggi et al., 2008; Klingberg, 2010). This is partially driven by the time and monetary costs associated with conducting multisession, multiweek studies. Regardless, training studies can greatly improve the persuasiveness of their results by measuring transfer via several tasks that differ in peripheral aspects but converge on an ability of interest (e.g., a verbal, Gf, and spatial task from Figure 3). If a training effect is robust, it should be apparent in all tasks.
En utilisant un groupe de contrôle actif, considéré comme étant essentiel pour détecter les mécanismes responsables des transferts après les entraînements cognitifs, plus précisément une formation de recherche visuelle, “Because visual search performance is not likely to be determined by WM capacity, visual search training is unlikely to improve WM capacity. By comparing a visual search group that did not train WM to a dual n-back group that arguably did train WM, we can separate the potential transfer effects due to improving WM from those associated with placebo-type effects (Shipstead et al., 2010; Sternberg, 2008).” (p. 13), Redick et al. ont trouvé dans un total de 17 tests cognitifs que “Out of 17 ANOVAs, there were no significant Group x Session interactions”. Voici les résultats détaillés :
Given our emphasis on using multiple indicators of a construct instead of single tasks, we also examined transfer performance as a function of ability z-composites for the tasks representing fluid intelligence (separate spatial and nonspatial factors), multitasking, WM capacity, crystallized intelligence, and perceptual speed. … Overall, the z-composite analyses confirm the lack of transfer observed in the individual task analyses. Note that the marginal results for the gain from pre- to mid-test for the multitasking composite represent greater improvement for the no-contact control group relative to the other two groups (see Table 2).
To facilitate comparisons with previous research, we re-analyzed all transfer data excluding the visual search group. The results matched the full analyses – no transfer for the dual n-back group relative to the no-contact control group. In addition, we reanalyzed all transfer data excluding the mid-test session, comparing only the pre- and post-test sessions, and, again, we found no transfer for the dual n-back group relative to the no-contact or active control groups. Finally, we conducted ANCOVAs for each transfer task, using the pre-test score as the covariate. The results were qualitatively the same as the ANOVA results presented in Table 3. [6]
Variables that affect transfer
If WM training, and more specifically dual or single n-back training, can actually cause real improvements in fluid intelligence, then the diversity of transfer results across studies indicates that there are important boundary variables that can mediate or moderate training effectiveness. A recent study with children that trained on an adaptive single nback task identified the amount of n-back improvement as a critical variable determining whether or not transfer to intelligence was observed (Jaeggi, Buschkuehl, Jonides, & Shah, 2011). When Jaeggi et al. (2011) halved the n-back training group based on the amount of improvement observed, the children with the biggest gain showed transfer relative to an active-control group, whereas the children with smaller gains did not. We therefore attempted a similar analysis, by dividing our dual n-back subjects into high and low improvement groups, using a median split on the difference score of mean dual nback level in sessions 19-20 versus sessions 1-2. This post-hoc analysis is limited by sample size (only 12 and 12 subjects in the high- and low-improvement groups, respectively), but with that caveat in mind, no significant Group (high dual n-back improvement, low dual n-back improvement, no-contact control) effects were obtained for the fluid intelligence, multitasking, and WM composite standardized gains (Table 7). A similar median-split analysis for the visual search group (15 and 14 subjects in the high- and low-improvement groups, respectively) also produced no significant Group effects on the composite standardized gains (Table 7).

We also correlated the amount of training gain and transfer gain for the same four standardized gain composites (Table 7). Dual n-back improvement was not associated with fluid intelligence gains; it was marginally correlated with WM capacity improvement but, surprisingly, visual search improvement was also correlated with improvement on the verbal fluid intelligence tasks (Supplemental Materials, Figure S4). Other WM training studies (Chein & Morrison, 2010; Jaeggi et al., 2011) reporting significant correlations between training change and transfer change suffer from the same limitations as our data for such correlational analyses – small sample sizes and the influence of subjects who performed worse at post-test than pre-test on the transfer tasks (i.e., negative value for transfer gain) and performed worse at the end of training than the beginning of training on the training task (i.e., negative value for training gain). Indeed, in our data, the correlation between visual search change and verbal fluid intelligence change was no longer significant, r(28) = .25, p = .20, after removing the lone subject who had negative values on both variables.
Précédemment, Colom et al. (2010, pp. 5-7, Figures 1 & 2) n’ont pas trouvé la moindre preuve que les améliorations de scores sur les tests administrés sous des conditions intellectuellement exigeantes avec une durée de test plus étendue étaient corrélées avec la charge en g : “(a) the rate of performance improvements in tasks requiring high degrees of effortful (complex) processing was much smaller across sessions, but still related to pre-test intelligence scores, whereas (b) the rate of performance improvements in tasks requiring very low levels of effortful (simple) processing remained high across sessions, but progressively least correlated with pre-test intelligence scores”. Une fois de plus, des améliorations dans le travail de mémoire ne sont pas liées à g.
Fig. 1. summarizes average changes (d units) for STM, WMC, PS and ATT from session 1 to session 2, as well as from session 2 to session 3. There is a great reduction of improvements for STM and WMC in session 3, while improvements remain at high levels for PS and ATT. We computed confidence intervals for the values shown in Fig. 1: STM (S1–S2 = .47 and .57; S2–S3 = .09 and .21), WMC (S1–S2 = .27 and .36; S2–S3 = .13 and .22), Speed (S1–S2 = .53 and .57; S2–S3 = .42 and .46), Attention (S1–S2 = .71 and .73; S2–S3 = .56 and .62). Therefore, improvements for STM and WMC in the last session are very small, whereas for Speed and Attention these improvements are still large.

Finally, Fig. 2 depicts correlations between average intelligence in the pretesting session and performance across sessions for STM, WMC, PS, and ATT. Interestingly, these correlations do not change across sessions for STM and WMC, whereas they show a systematic decrease for PS and ATT (z values for PS and ATT were 2.91 and 2.93 respectively, p < .01).
Les recherches de Colom sont cohérentes avec celles de te Nijenhuis et al. (2007) qui ont trouvé une corrélation négative entre l’entraînement cognitif et la charge/saturation en g. Une des possibles raisons serait l’héritabilité de g (Hu, Sept.5.2013) et la forte stabilité de g (Beaver et al., 2013) au cours de la période de développement.
3. First test of Jensen’s hypothesis: studies on repeated testing and g loadedness
In a classic study by Fleishman and Hempel (1955) as subjects were repeatedly given the same psychomotor tests, the g loading of the tests gradually decreased and each task’s specificity increased. Neubauer and Freudenthaler (1994) showed that after 9 h of practice the g loading of a modestly complex intelligence test dropped from .46 to .39. Te Nijenhuis, Voskuijl, and Schijve (2001) showed that after various forms of test preparation the g loadedness of their test battery decreased from .53 to .49. Based on the work of Ackerman (1986, 1987), it can be concluded that through practice on cognitive tasks part of the performance becomes overlearned and automatic; the performance requires less controlled processing of information, which is reflected in lowered g loadings.
17. Discussion
The findings suggest that after training the g loadedness of the test decreased substantially. We found negative, substantial correlations between gain scores and RSPM total scores. Table 4 shows that the total score variance decreased after training, which is in line with low-g subjects increasing more than high-g subjects. Since, as a rule, high-g individuals profit the most from training – as is reflected in the ubiquitous positive correlation between IQ scores and training performance (Jensen, 1980; Schmidt & Hunter, 1998) – these findings could be interpreted as an indication that Feuerstein’s Mediated Learning Experience is not g-loaded, in contrast with regular trainings that are clearly g-loaded. Substantial, negative correlations between gain scores and RSPM total scores are no definite proof of this hypothesis, but are in line with it. Additional substantiation of our hypothesis that the Feuerstein training has no or little g loadedness is that Coyle (2006) showed that gain scores loaded virtually zero on the g factor. Moreover, Skuy et al. reported that the predictive validity of their measure did not increase when the second Raven score was used. The fact that individuals with low-g gained more than those with high-g could be interpreted as an indication that the Mediated Learning Experience was not g-loaded. It should be noted, however, that Feuerstein most likely did not intend his intervention to be g-loaded. He was interested in increasing the performance of low scorers on both tests and external criteria.
18. General discussion
The findings show that not the high-g participants increase their scores the most – as is common in training situations – but it is the low-g persons showing the largest increases of their scores. This suggests that the intervention training is not g-loaded.
L’histoire était trop belle pour être vraie. Il est important d’expliquer pourquoi nous devrions nous attendre à de multiples échecs et déceptions en ce qui concerne ce genre d’expériences, même si les améliorations de scores auraient été prouvées être durables, après pris en compte des facteurs confondants (Shipstead et al., 2010, p. 251).
Premièrement, les gains et les effets de transfert doivent être permanents durant toutes les années suivant le test. Il n’y aurait aucune bonne raison à cela cependant. Même les interventions éducatives les plus intensives et subventionnées visant à améliorer le QI des plus pauvres américains ont tous échoué à produire des effets durables sur le QI. Effectivement, les gains de QI s’évaporent avec le temps (Herrnstein & Murray, 1994, pp. 405-406; Leak et al., 2010, pp. 8-10). Comme l’a indiqué Hambrick (2012) : “We shouldn’t be surprised if extraordinary claims of quick gains in intelligence turn out to be wrong”. Cela n’aurait effectivement aucun sens si les moyens les plus difficiles pour augmenter le QI échouent alors que les moyens les plus aisés réussissent. Il semble aujourd’hui que les preuves se dessinent très nettement : Hulme & Melby-Lervåg (2012) et Shipstead et al. (2012b) ont démontré que les gains s’évaporent au bout de seulement quelques mois, et que ces gains spécifiquement reflètent essentiellement la familiarité des tests. Un large panel d’étude est méthodologiquement défaillant et une longue série d’échec de réplication s’en est suivie.
Deuxièmement, pour être efficaces, les gains de QI dérivés de l’entraînement au travail de mémoire doivent améliorer les résolutions de problèmes du même type que ceux qui se produisent habituellement dans la vie de tous les jours. En d’autres termes, l’augmentation de l’intelligence doit avoir un impact sur le monde réel. Mais pourquoi toute amélioration dans la résolution d’une tâche spécifique conduirait à un accroissement de la capacité cognitive générale ? Charles Murray (2005) répond à cette question en se servant de l’analogie suivante : “Suppose you have a friend who is a much better athlete than you, possessing better depth perception, hand-eye coordination, strength, and agility. Both of you try high-jumping for the first time, and your friend beats you. You practice for two weeks; your friend doesn’t. You have another contest and you beat your friend. But if tomorrow you were both to go out together and try tennis for the first time, your friend would beat you, just as your friend would beat you in high-jumping if he practiced as much as you did”. Précédemment, Herrnstein et Murray avaient étudié dans leur fameux ouvrage “The Bell Curve” (in 1994) le Milkwaukee Project, visant à augmenter le QI des noirs de mères pauvres ayant un QI en dessous de 75 grâce à l’entraînement cognitif, qui a été un pur échec dans son objectif à augmenter le QI. Peu après que le projet ait commencé, il est apparu que le QI des noirs avait augmenté de 25 points – un gain tout simplement massif. Dès l’âge de 12 ou 14 ans, les gains semblent s’être évaporés, même si leur QI reste 10 points supérieur à celui du groupe de contrôle. Pourtant, la principale conclusion est que le gain de QI n’a pas été accompagné par une amélioration dans la performance scolaire comparée au groupe de contrôle. C’est pourquoi :
… Charles Locurto and Arthur Jensen have concluded that the program’s substantial and enduring gain in IQ has been produced by coaching the children so well on taking intelligence tests that their scores no longer measure intelligence or g very well.
Dans The g Factor, p. 340, Jensen a fait remarquer que le Milwaukee fut une entreprise extrêmement coûteuse en argent. Il note aussi que les sous-tests entraînés qui furent les plus dissimilaires au fur et à mesure des tests et re-tests sont également ceux qui ont montré les plus forts déclins. Ces tests sont évidemment ceux qui ont montré de moindre transferts. L’effet de transfert diminue au fur et à mesure que les tests deviennent de plus en plus dissimilaires.
Ce phénomène est bien documenté par te Nijenhuis (2007), qui a établi que les tests de QI perdent leur charge en g avec le temps à cause des résultats de l’entraînement, de la familiarité, et du re-testing. Évidemment, le test de QI ne reflète pas la capacité à répéter la même tâche, mais la capacité à résoudre un problème nouveau. Les tests d’intelligence n’ont pas été conçus pour résister à la pratique. Pas surprenant que l’entraînement cognitif ‘améliore’ les scores de QI. Au final, il est intéressant de noter que si l’opinion populaire selon laquelle les scores de QI reflètent simplement et rien d’autre que la capacité à faire un test de QI, était véridique, alors on aurait dû constater de forts gains de QI (g) après des sessions d’entraînements cognitifs. Mais tel ne fut pas le cas.
Références :
- Brehmer Yvonne, Westerberg Helena and Bäckman Lars, 2012, Working-memory training in younger and older adults: training gains, transfer, and maintenance.
- Chooi Weng Tink, 2011, Improving Intelligence by Increasing Working Memory Capacity.
- Chooi Weng Tink, and Thompson Lee A., 2012, Working memory training does not improve intelligence in healthy young adults.
- Colom Roberto, Quiroga Mª Ángeles, Shih Pei Chun, Martínez Kenia, Burgaleta Miguel, Martínez-Molina Agustín, Román Francisco J., Requena Laura, Ramírez Isabel, 2010, Improvement in working memory is not related to increased intelligence scores.
- Conway Andrew R.A., and Getz Sarah J., 2010, Cognitive Ability: Does Working Memory Training Enhance Intelligence?.
- Fox Mark C., and Charness Neil, 2010, How to Gain Eleven IQ Points in Ten Minutes: Thinking Aloud Improves Raven’s Matrices Performance in Older Adults.
- Hambrick David Z., 2012, I.Q. Points for Sale, Cheap.
- Herrnstein Richard J., and Murray Charles, 1994, The Bell Curve.
- Hulme Charles, Melby-Lervåg Monica, 2012, Current evidence does not support the claims made for CogMed working memory training.
- Jaeggi Susanne M., Buschkuehl Martin, Jonides John, and Perrig Walter J., 2008, Improving fluid intelligence with training on working memory.
- Jaeggi Susanne M., Studer-Luethi Barbara, Buschkuehl Martin, Su Yi-Fen, Jonides John, Perrig Walter J., 2010, The relationship between n-back performance and matrix reasoning — implications for training and transfer.
- Jaeggi Susanne M., Buschkuehl Martin, Jonides John, and Shah Priti, 2011, Short- and long-term benefits of cognitive training.
- Jensen R. Arthur, 1998, The g Factor: The Science of Mental Ability.
- Leak Jimmy, Duncan Greg J., Li Weilin, Magnuson Katherine, Schindler Holly, Yoshikawa Hirokazu, 2010, Is Timing Everything? How Early Childhood Education Program Impacts Vary by Starting Age, Program Duration and Time Since the End of the Program.
- Melby-Lervåg Monica, and Hulme Charles, 2012, Is Working Memory Training Effective? A Meta-Analytic Review.
- Moody David E., 2009, Can intelligence be increased by training on a task of working memory?.
- Murray Charles, 2005, The Inequality Taboo.
- Redick Thomas S., Shipstead Zach, Harrison Tyler L., Hicks Kenny L., Fried David E., Hambrick David Z., Kane Michael J., Engle Randall W., 2012, No evidence of intelligence improvement after working memory training: A randomized, placebo-controlled study.
- Seidler Rachael D., Bernard Jessica A., Buschkuehl Martin, Jaeggi Susanne, Jonides John, Humfleet Jennifer, 2010, Cognitive Training as an Intervention to Improve Driving Ability in the Older Adult.
- Shipstead Zach, Redick Thomas S., and Engle Randall W., 2010, Does working memory training generalize?.
- Shipstead Zach, Redick Thomas S., and Engle Randall W., 2012a, Is Working Memory Training Effective?.
- Shipstead Zach, Hicks Kenny L., Engle Randall W., 2012b, Cogmed working memory training: Does the evidence support the claims?.
- Sternberg Robert J., 2008, Increasing fluid intelligence is possible after all.
- te Nijenhuis Jan, van Vianen Annelies E.M., van der Flier Henk, 2007, Score gains on g-loaded tests : No g.
- Thompson Todd W. et al., 2013, Failure of Working Memory Training to Enhance Cognition or Intelligence.
- Zinke Katharina, Zeintl Melanie, Eschen Anne, Herzog Carole, Kliegel Matthias, 2012, Potentials and Limits of Plasticity Induced by Working Memory Training in Old-Old Age.

Mouais, j’y ai joué un peu et ça m’a rapidement gonflé sans que je puisse dire si ça avait eu de l’effet ou pas.
Il y a une FAQ intéressante la-dessus;
http://www.gwern.net/DNB%20FAQ
On peut donc (sans surprise) améliorer ses scores aux tests de QI, mais pas son QI …
si j’ai bien compris.
Le site de gwern est excellent. C’est d’ailleurs chez lui que j’ai pioché quelques unes des études dont j’ai commenté et référencé. Par contre, je n’ai jamais essayé le dual n-back. Peut-être un jour, juste par curiosité.
Sinon, pour yoananda, je préférerais dire que les scores de QI s’améliorent mais pas l’intelligence. Parce que le QI, ça se mesure par des scores.
Au fait, si l’un de vous d’eux (ou quelqu’un d’autres dans la salle) possède des données sur les scores et évaluations scolaires au UK, qu’il me fasse signe. Il y a quelque chose de louche au UK. Alors que partout dans le monde, les écarts de QI entre blancs et noirs sont restés approximativement à 1 écart type, les noirs au UK semblent avoir un QI de 92 ou 93, soit 7-8 points supérieurs aux USA et autres pays européens – cette réduction de l’écart de QI blanc-noir s’est produit très récemment, sur les dernières années, soit un temps extrêmement court. Pourtant, les données dont je dispose pour les USA réfutent clairement l’idée de la pauvreté et de la culture comme explication des disparités. Le fait que le IQ gap au UK s’est rétréci aussi vite me laisse encore plus sceptique quant à la viabilité de l’explication culturelle.